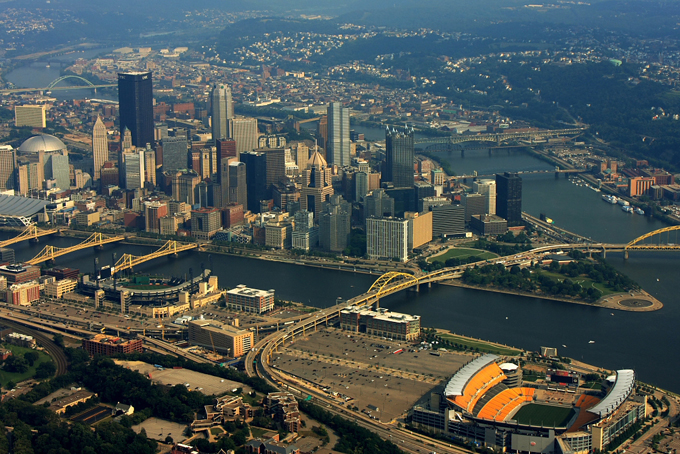
Pittsburgh aerial view looking from the North Shore
While violent crime in the city of Pittsburgh went down by 4.4 percent, property crime citywide increased by 8.5 percent in 2012, according to the Pittsburgh Police Bureau’s Annual Report released in June.
Crime reports like these have the potential to drive residential and commercial development in city neighborhoods. However, the statistics in the most recent report don’t seem to show which neighborhoods have the highest crime rates.
For instance, the North Shore, which has seen an increase in development over the past ten years, had a crime rate of 100, while Lincoln Lemington Belmar, which has seen next to no development in the past ten years only had a crime rate of 11.3.
According to the report, South Shore and Chateau are the neighborhoods with the highest crime rates in the city. While these two neighborhoods had rates of 1505 and 1336, respectively, most of the other neighborhoods had rates below 50.
These rates are determined by taking the number of crimes per 100 citizens. Since Chateau and South Shore are not heavily residential areas, with fewer citizens than other neighborhoods, their crime rates are skewed.
For this reason, the New Pittsburgh Courier asked representatives from the police department to clarify the neighborhood crime statistics. The department would not say whether they noticed any interesting trends when compiling the crime rates for different neighborhoods or which neighborhoods have the most crime, but did explain how population, square miles, the number of calls for service, arrests and crime rates are used to direct police activity.
“This can actually be viewed from two perspectives—in terms of raw crime numbers or in terms of crime rates,” said John Warren, who helped compile the report. “At the Bureau level, we look at crime trends Citywide and within each zone. The zone commanders, working with their crime prevention officers, monitor neighborhood crime trends and develop strategies to reduce crime.”
The section of the report containing the neighborhood crime statistics cautions against comparing statistics by neighborhood because they do not take in all of the variables that mold crime in a particular area.
“We don’t compare crime rates neighborhood to neighborhood. Neighborhood crime rates, just like city crime rates, should be used as the basis to determine how crime is trending over time within a particular neighborhood, zone or city. Crime rates should be used to compare a neighborhood to itself over periods of time rather to other neighborhoods,” Warren said. “As an example, when you analyze citywide data comparing 2011 Part I Crime to 2012 Part II Crime, you will note that there is slight overall increase in crime. Digging deeper, you can then determine that the major cause for the increase was due to an increase in thefts from vehicles.”
These kinds of year-to-year comparisons can also present a picture of how effective the police force has been at reducing crime from year to year. According to the report, the department’s clearance rate increased between 2011 and 2013.
The average clearance rate for property crimes was 26 percent, an increase from an average of 15 percent in 2011. Similarly, the average clearance rate for violent crime was 62 percent, an increase from an average of 47 percent the previous year.
Your comments are welcome.
Follow @NewPghCourier on Twitter https://twitter.com/NewPghCourier
Like us at https://www.facebook.com/pages/New-Pittsburgh-Courier/143866755628836?ref=hl
Download our mobile app at https://www.appshopper.com/news/new-pittsburgh-courier