by Justin Nix, University of Nebraska Omaha
In the lead-up to the 2022 midterm elections, Republican candidates across the nation are blaming Democrats for an increase in crime.
But as a scholar of criminology and criminal justice, I believe it’s important to note that, despite the apparently confident assertions of politicians, it’s not so easy to make sense of fluctuations in the crime rate. And whether it’s going up or down depends on a few key questions:
- What you mean by “crime,”
- What the “up” or “down” comparisons are in reference to, and
- The location or area being examined.
Here’s an explanation of those elements – and why there is no one answer to whether crime has increased in the past year, or over the past decade.
What is ‘crime,’ anyway?

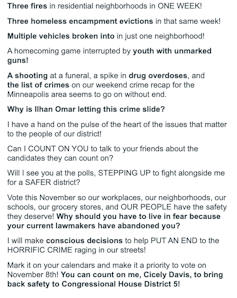
Cicely Davis campaign email
Usually when politicians, public officials and scholars talk about crime statistics, they’re referring to the most serious crimes, which the FBI officially calls “index” or “Part 1” offenses: criminal homicide, rape, robbery, aggravated assault, burglary, larceny, motor vehicle theft and arson.
Because these crimes vary a great deal in terms of seriousness, experts break this list up into “violent” and “property” offenses, so as not to confuse a surge in thefts with an increase in killings.
Each month, state and local police departments tally up the crimes they have handled and send the data to the FBI for inclusion in the nation’s annual Uniform Crime Report.
But that system has limitations. According to the U.S. Bureau of Justice Statistics, fewer than half of all events that could count as crimes actually get reported to police in the first place. And police departments are not required to send information about known crimes to the FBI. So each year what are presented as national crime statistics are derived from whichever of the roughly 17,000 police departments across the country decide to send in their data.
In 2021, the optional nature of reporting crime statistics was a particular problem, because the FBI asked for more detailed information than it had in the past. Historically, the bureau received data from police departments covering about 90% of the U.S. population. But fewer agencies supplied the more detailed data requested in 2021. That data covered only 66% of the nation’s population. And the patchwork wasn’t even: In some states, such as Texas, Ohio and South Carolina, nearly all agencies reported. But in other states, such as Florida, California and New York, participation was abysmal.
With those caveats in mind, the 2021 data estimates that criminal homicide rose about 4% nationally from 2020 levels. Robberies were down 9%, and aggravated assaults remained relatively unchanged.
Rapes are notoriously underreported to police, but the 2021 National Crime Victimization Survey suggests there was no significant change from 2020.

What’s the benchmark?
Those comparisons look at the prior year to assess whether certain types of crime are up or down. Such comparisons may seem straightforward, but violent crime, particularly homicide, is statistically rare enough that a rise or fall from one year to the next doesn’t necessarily mean there is reason to panic or celebrate.
Another way to assess trends is to look at as much data as possible. Over the past 36 years, clear trends have emerged. The national homicide rate in 2021 wasn’t as high as it was in the early 1990s, but 2021’s figure is the highest in nearly 25 years.
Meanwhile, robberies have been trending steadily downward for the better part of 30 years. And though the aggravated assault rate didn’t change much from 2020 to 2021, it is clearly higher now than at any time during the 2010s.

Crime is highly localized
These figures are imperfect in other ways, too. The data being used in today’s assertions about crime rates is more than 10 months old and presents national figures that mask a substantial amount of local variation. The FBI won’t release 2022 crime data until the fall of 2023.
But there is more current data available: The consulting firm AH Datalytics has a free dashboard that compiles more up-to-date murder data from 99 big cities.
As of October 2022, it indicates that murder in big cities is down about 5% in 2022 when compared with the first 10 months of 2021. But this aggregate change masks the fact that murder is up 85% in Colorado Springs, Colo.; 33% in Birmingham, Ala.; 28% in New Orleans; and 27% in Charlotte, N.C. Meanwhile, murder is down 38% in Columbus, Ohio; 29% in Richmond, Va.; and 18% in Chicago.
Even these city-level statistics don’t tell the whole story. It is now well established that crime is not randomly distributed across communities. Instead, it clusters in small areas that criminologists and police departments often refer to as “hot spots.” What this means is that regardless of whether crime is up or down in cities, a handful of neighborhoods in those cities are likely still significantly and disproportionately affected by violence.
Justin Nix, Associate Professor of Criminology and Criminal Justice, University of Nebraska Omaha
This article is republished from The Conversation under a Creative Commons license. Read the original article.